The damage tolerance approach to design has been employed by the aerospace industry for decades. In contrast to the safe life design method, damage tolerance explicitly accounts the fatigue crack growth process. This design approach takes advantage of the portion of service life a component can have with a growing fatigue crack. Crack inspection, detection and repair protocols are implemented to prevent fatigue cracks from growing too large and causing failure.
Advantages over Safe Life Design
The foundation of damage tolerance is the concept of fracture mechanics, and through its use, the determination of a stress intensity factor (SIF). This factor (which also can be denoted as K) governs the fatigue crack growth under a set of conditions (loading and geometry) for a given analysis. The fatigue crack growth rate can be determined by calculating the SIF and by experimentally-deriving parameters inherent in the material being examined. In contrast to the issues in similitude that are encountered in safe life design, the incorporation of loading and geometrical factors through fracture mechanics allows the damage tolerance method to achieve similitude for different loads, different crack sizes, and different crack shapes. This means that the only physical testing needed to assess the durability of different design geometries is simple coupon testing for the material parameters. Standard methods have been developed for determining the material parameters using far fewer test specimens than needed to create a S-N curve.
Inputs from finite element analysis are used with fracture mechanics to determine how the spatial stress distributions affect the crack growth rates, thereby providing a straightforward way to assess design changes in durability. This is a higher-fidelity analysis compared with safe life design, which only considers the peak stress in the component. The effects of fillets and other geometric features can be readily assessed using the damage tolerance approach. Residual stress can be directly incorporated into the stress intensity factor. The “sequencing” effect of variable cyclic load levels (e.g. “a high load followed by a low load” vs. “a low load followed by a high load”) can be assessed. Advanced techniques in fracture mechanics adjust the SIF with various energy terms to account for crack face interaction and other physical phenomena. With these methods, mean stress effects and complex load missions can be assessed.
Limitations
While damage tolerant design can be very effective in improving similitude among varying loads, crack sizes and shapes, there are drawbacks. In most fracture mechanics methods, an initial crack must be assumed in the geometry. By assuming this initial crack, the percent of the specimen’s (or component’s) lifetime spent developing that crack is not accounted-for in determining the durability of the design; the total life of the design may thus be underestimated. In general, the higher the ultimate strength of the material, the higher the percent of lifetime is actually spent developing the initial crack. The initial crack is further assumed to be relatively large (commonly 1/32 inch or 0.8mm; at least one order of magnitude larger than typical size scales of the plastic zone and the material microstructure).

Crack growth data for 12 steel specimens tested in rotating bend fatigue with an initial crack size of 0.8mm (Sasaki et al., 1987).
The above figure compares crack growth data for 12 high strength steel specimens tested in rotating bend fatigue (Sasaki et al., 1987). The specimens were notched with a stress concentration factor (Kt) of about 3. This means that the surface stress at the center of the notch is about 3 times greater than the surface stress of a completely smooth specimen. The notched specimens were tested at a nominal stress amplitude (not adjusted for the stress concentration) of 58 ksi. The initial size for crack measurement is 0.8 mm, the lower limit for traditional fracture mechanics. Because the cracks grew quickly and caused failure not long after they reached 4 mm, the maximum allowable crack size in this experiment was set to 4 mm. Notice the limited scatter among the tests in the cycles to 4 mm. Of the 12 specimens, the quickest to 4 mm was 31,000 cycles while the longest to 4 mm was 43,000 cycles. This gives an average of about 37,000 cycles with a spread of about ±15%. On the other hand, the S-N curve for the notched specimens without an initial crack yields an average life of about 125,000 cycles. Herein lies the problem: the assumption of a crack, which is required in fracture mechanics, is conservative, ignoring 70% of the average lifetime in its estimate in this example.
Minimum lifetime is a different story. Because of better similitude and the conservative assumption of having a relatively large initial crack, it is common practice to use the average life in fatigue analysis using fracture mechanics; in this case, 37,000 cycles. The design-allowable life using the S-N curve (-3σ) is about 31,000 cycles. Therefore, even with the conservative assumption of the existence of a crack, better understanding of the physics using fracture mechanics could provide a higher design allowable life. Sometimes, the use of fracture mechanics does not give a higher life; this depends on the design and material of the component. It should be noted that in situations where components are inspected to assure safe operation, the inspection interval is often set to half of the average damage tolerance life. This gives an inspector two opportunities to discover the crack (and repair the location, if necessary) before failure.
If fracture mechanics could be extended to smaller and smaller crack sizes, a better estimate of the true lifetime could be predicted. This has been the goal of researchers for many years. The following figure shows the crack growth data for 12 high strength steel specimens tested in rotating bend in which crack growth is measured from an initial crack size of 0.2 mm (Sasaki et al., 1987). The average life here is about 115,000 cycles (ranging from 99,000 to 131,000 cycles with a similar spread of ±15%). This is more than three times the fatigue life than if an initial crack size of 0.8 mm is assumed. The problem is that traditional fracture mechanics is not applicable to this smaller crack size; the assumption that the crack is large compared to the plastic zone is violated, and the size of the crack is approaching the size of the material’s microstructural features.

Crack growth data for 12 steel specimens tested in rotating bend fatigue with an initial crack size of 0.2mm (Sasaki et al., 1987).
In moving to smaller crack sizes, the above assumption violation has commonly been divided into two problems: the problem of the physically small crack and the problem of the microstructurally small crack. The physically small crack grows much faster than a large crack with the same stress intensity factor. The faster growth rate of the physically small crack is attributed to a cracked surface that is too small to have built up appreciable roughness. Long cracks have roughness/plastic strain-induced closure such that the crack tip is not opened until the applied stress exceeds a certain value; closure effectively reduces the stress amplitude. Thus the physically small crack, without the aid of closure, has higher stress amplitudes and therefore higher crack growth rates than long cracks. Several advanced fracture mechanics methods that adjust for this closure phenomenon have been developed over the past two decades (Newman, 2003). These methods require more and different testing than traditional fracture mechanics; therefore, they are more expensive to develop. But when considering the potential impact in the available design life, they can be a worthwhile investment.
Fracture mechanics for the microstructurally small crack has advanced down to the naturally-occurring microstructural features of grains, voids, and inclusions (Tanaka and Mura, 1981). Although fracture mechanics concepts are used, these features are so small that there is no well-defined crack; the term “microstructurally small crack” has therefore been replaced with microstructural crack nucleation. Similar to cracks, the microstructural features are discontinuities in the material matrix and, like cracks, can cause damage under loading. Unlike the typical fracture mechanics analysis assumption of a single crack, these features exist throughout the material; there are tens of thousands (if not millions) in any given component. Performing a fracture mechanics analysis of all of the microstructural features in a component to determine which ones nucleate damage, grow and coalesce with neighboring features to cause failure is a daunting task. To solve this problem, statistical methods have been combined with fracture mechanics to develop computational software that takes fracture mechanisms down to the true fatigue damage initiation size.
VEXTEC’s Virtual Life Management (VLM) Tool
Over the past 12 years, VEXTEC has developed a probabilistic computation tool called Virtual Life Management (VLM), which provides the algorithms that link the microstructural material properties and non-continuum mechanics. In this approach, the elements are defined as the individual microstructural features (grains, voids, and inclusions) of a polycrystalline aggregate (Tryon, 2005). Each feature is considered a single element with homogeneous (non-varying) properties. The properties vary from feature to feature. The macrostructure is modeled as an ensemble of these features. The material properties of this ensemble are defined using the appropriate statistical distributions for a given material.
The VLM software also recognizes the multiple stages of fatigue damage accumulation such as crack nucleation, small crack growth and long crack growth that lead to failure. Each stage is driven by different mechanisms and is distinctly modeled. The stages must be quantitatively linked because the crack successively grows from one stage to the next. In VLM, theoretical micromechanical models are used to determine the number of cycles necessary to nucleate a crack in the microstructure. A combination of models based on empirical observations and theoretical micromechanics are used to determine the number of cycles spent in the small crack regime to grow the cracks from nucleation to the long crack stage. Conventional fracture mechanics is then used to determine the number of cycles necessary for the crack to grow through the long crack regime to the critical crack size. Failure of the macrostructure is defined by the first VLM-simulated crack to nucleate and grow beyond the critical crack size. The statistical distribution of fatigue life for the macrostructure is determined using Monte Carlo simulation methods. This probabilistic model provides a direct quantitative link between the variations in the material microstructure and the scatter in the fatigue behavior.
The figure below compares the VLM predictions of a smooth titanium fatigue specimen with laboratory test data. The predictions were developed based on 1) data derived from typical monotonic material property testing, 2) a single fatigue specimen tested at 90 ksi, and 3) photographs of the material microstructure to measure the statistical distributions of the sizes and populations of the microstructural features. The solid circles represent laboratory test data; the hollow circles are the VLM predictions. Notice at each stress level there are many predictions. This is because Monte Carlo methods were used to simulate 20 specimens at each stress level. The simulation produced a unique microstructure for each specimen just like the actual specimens, and just like the actual specimens, each specimen has a different fatigue lifetime. Notice also that the predictions do a good job of capturing the change in fatigue lifetime with stress level. The predictions captured the increase in scatter as the stress is reduced, the “knee” (a discontinuity seen in some materials representing a fatigue transition point at higher cycles) of the S-N curve, and the “run-outs” (specimens which did not fail) at 1.E+08 cycles. The figure also shows that the VLM software does a good job of capturing the behavior of the notched fatigue specimen (solid diamonds represent laboratory test data; hollow diamonds are the VLM prediction), using not specimen data but just the geometry and local notch stress state derived from finite element modeling.
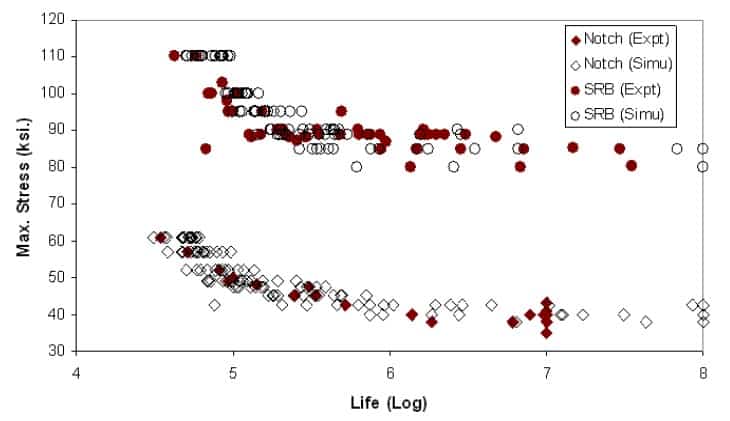
VLM prediction of smooth and notched titanium fatigue specimen with laboratory test data.
VLM is a powerful tool because the conservative fracture mechanics assumption of the existence of a large initial crack is not required, and the similitude issues of the S-N curve are avoided. Using typical fracture mechanics material testing and a few S-N tests of simple smooth specimens, the fatigue behavior of notches, fillets, and other geometric features can be assessed. The other major important aspect of VLM is that the scatter in the fatigue lifetime is predicted. This method has been applied directly to finite element models of complex components to predict the mean and scatter in fatigue life of the final component design. The application of VLM results in huge savings in cost and time compared to the manufacture and testing of actual components. Virtual Life Management has shown the ability to improve the accuracy and robustness of fatigue durability predictions.
References
Sasaki, S.K., Ochi, Y., Ishii, A., “Statistical Investigation of Surface Fatigue Cracks in Large-Sized Turbine Rotor Shaft Steel”, Engg. Fract. Mech., vol. 28, issues 5-6, pp. 761-772, 1987.
Newman, J.C., Jr., “Numerical Modeling of Fatigue Crack Growth”, Chapter in Comprehensive Structural Integrity, vol. 4, R.O. Ritchie and Y. Murakami, editors, Elsevier, 2003.
Tanaka, K., Mura, T., “A Dislocation Model for Fatigue Crack Initiation”, ASME J. Appl. Mech., vol. 48, pp. 91-103, 1981.
Tryon, R.G., “Using Probabilistic Microstructural Methods to Predict the Fatigue Response of a Simple Laboratory Specimen”, Chapter 42 in Engineering Design Reliability Handbook, E. Nikolaidis, D. Ghiocel, S. Singhal, editors, CRC Press, 2005.


Leave A Comment