The philosophy of safe life design is the preferred method for designing components for durable operation in the automotive industry. Under this method, the structure is operated at a stress far below the fatigue strength of the component. By doing this, the designer assumes that the structure will not form a detectable crack during its service life, thus reducing the risk of failure.
Safe life design uses an experimentally-determined S-N curve to evaluate operational limits. This curve relates the magnitude of the cyclic stress (S) on a test specimen to the number of cycles to specimen failure (N). The curve is dependent on many conditions, including the ratio of maximum load to minimum load (R-ratio), the type of material being examined, and the frequency at which the cyclic stresses (or strains) are applied. Typically, as the load decreases, the life of the specimen increases. The practical limit of experimental testing has been 106 or 107 cycles, due to frequency limitations of hydraulic-powered test machines. If the resulting component operates at stresses above the fatigue strength, it is said to be a life limited component. If the component operates at stresses below the fatigue strength, it is said to be an infinite life-designed component. Issues which continually hinder the creation of an appropriate S-N curve for safe life design are similitude and scatter.
The concept of similitude is used in component design and testing, relating the similarity of the test specimen to the component that it is supposed to represent. This similarity is broken-down into three types: geometric similarity, kinematic similarity, and dynamic similarity. The higher the degree of similitude, the closer the test specimen is to the actual component. In most S-N curve testing, the specimens (coupons) are manufactured with a simplified design in order to be tested efficiently. However, this simple design will not typically reflect the actual geometrical and loading complexity of the component. Therefore, the empirical relationship derived in the coupon S-N curve testing cannot be directly applied to conditions outside this simple test specimen database. To account for this, large safety factors are included in the design’s predicted fatigue lifetime.
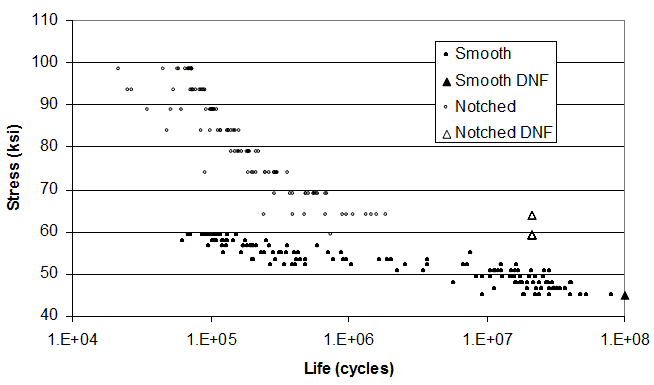
S-N curve of steel smooth round bar test specimens tested in rotating bend fatigue (Nishijima et al., 1987). Specimens which did not fail by 107 cycles are triangular symbols.
The above figure compares the S-N curve of smooth round bar specimens with notched round bar specimens tested in rotating bend fatigue (Nishijima et al., 1987). The steel material used to make the two different specimens is the same. The difference is in geometry: the notched specimen is created by machining a V-shaped groove into the center of a smooth specimen. The shape of this groove creates a stress concentration factor (Kt) of 3.5. This means that the surface stress at the center of the notched groove is 3.5 times greater than the surface stress of the completely smooth specimen. The Y-axis is the surface stress at the base of the groove for the notched specimens and the surface stress of the smooth specimens. Notice that there is not much similarity between the lives of the notched specimens and the smooth specimens with regard to surface stress. That means there is no similitude between the notched and smooth specimens. If the actual component to be designed has a notch or a fillet, the smooth round bar S-N curve is not applicable and a new S-N curve using notched round bars must be obtained. This process becomes expensive and time-consuming.
Further compounding this issue are the various geometries and loadings which can be tested. If notched bars with different Kt factors are tested, different S-N curves will be obtained. If the smooth bars are tested in axial pull fatigue instead of rotating bend fatigue, a different S-N curve will be obtained. If the bars are tested at a different mean stress, or if smooth bars with a larger diameter cross section are tested, different S-N curves will be obtained. It is evident that similitude breaks down very easily. In fact, the only method to determine the true S-N curve of a component is to test the actual component. This is very expensive and impossible to do until the component is designed and manufactured. Thus, S-N curves are used that are as similar as possible (given testing time and cost constraints) to the component being designed.
Scatter in the S-N Curve
Significant scatter can occur in the number of cycles to failure at any given stress level in a S-N curve. Let us return to the smooth round bar steel specimens tested in rotating bend fatigue, in the figure below. This figure shows only specimens tested to 107 cycles; if they did not fail by 107 cycles, they are test suspensions and are denoted by a triangle symbol.
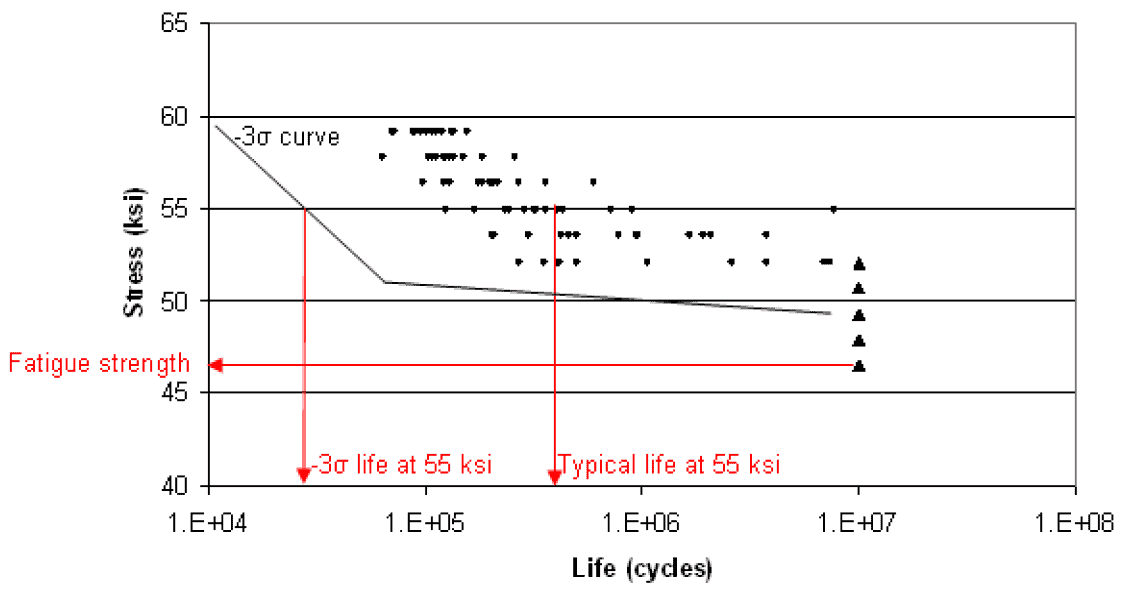
S-N curve of steel smooth round bar test specimens tested in rotating bend fatigue (Nishijima et al., 1987). Specimens which did not fail by 107 cycles are triangular symbols.
Approximately 12 bars were tested at each stress level. Although each bar is meticulously prepared to be similar to the other bars and to have no pre-existing damage, and the testing is highly-controlled to minimize any variations, there is still considerable scatter in the data. This is because fatigue damage nucleates on a very small size scale governed by the microstructure of each bar. And although the bars are as similar as possible, when viewed under a microscope, the microstructure of each bar is not identical. There is a natural variation of microstructure from bar to bar, and even within the same bar.
This variation can have a significant effect on the allowable design stress. Assuming a component was designed to have a stress of 55 ksi, the S-N curve in the above figure indicates that the typical life of the component would be about 500,000 (5.E+05) cycles. However, components are not designed to a typical life (50% risk of failure) but are instead designed to some lower tail of the life distribution. The curve shows that the “1 out of 12” lifetime is about 100,000 (1.E+05) cycles, an 80% reduction in life compared to typical. However, 1 out of 12 failures is still high in the tail for allowable design risk in most cases. The “-3σ” failure (one in 370 specimens, assuming a normal distribution) is closer to what is typically used for allowable design risk. When a statistical analysis is performed on this data, the -3σ life is about 30,000 (3.E+04) cycles at 55 ksi, or a 93% reduction in life compared to typical.
Assuming the component was designed to have an infinite life, the S-N curve above would be used to determine the allowable stress. At 52 ksi, some of the bars did not fail at 1.E+07 cycles. As is typical engineering practice, a few bars were tested below 52 ksi. None of these bars failed, and thus the fatigue limit is found to be 51 ksi (the highest stress where no bars failed). The safe life “design allowable stress” would then be set somewhat below the experimental fatigue limit. While there is no standardized procedure, often the allowable stress will be set to a relatively high percentage of the experimental fatigue limit (say, 90%). In this case, 90% of 51 ksi is approximately 46 ksi, and so 46 ksi would be the design’s allowable stress.
Seldom are a significant number of specimens tested at cycles greater than 1.E+07; it is simply too expensive and time-consuming. Nishijima et al. did test some specimens at lower stresses and higher cycles (see figure below).
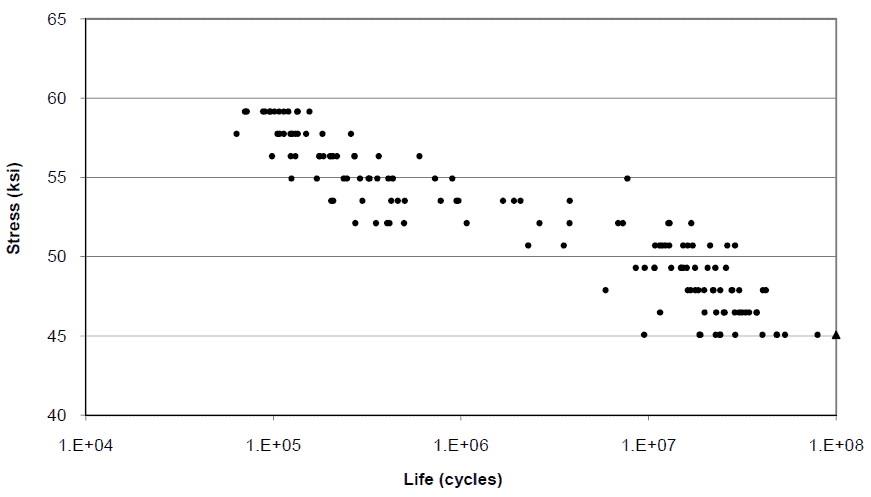
S-N curve of steel smooth round bar test specimens tested in rotating bend fatigue (Nishijima et al., 1987). Specimens which did not fail by 108 cycles are triangular symbols.
If 12 specimens are tested out to 1.E+08 cycles, failures do in fact occur below the previous 1.E+07 fatigue limit of 51 ksi. Because many bars were tested, some of them failed before 1.E+07 cycles. At the previously-assumed safe design allowable stress of 46 ksi, 11 of the 12 specimens failed before 1.E+08 cycles. In reality, the experimental fatigue limit stress can only be determined to a finite number of cycles; the allowable stress for infinite life cannot be known. So, even if a small percentage of the experimental fatigue limit stress is used as the design allowable, the risk of failure is unknown.
Acknowledging these issues of similitude and scatter, reductions in the expected design life and allowable stress for infinite life must be made. These reductions take the form of safety factors (or “knockdown” factors) to assure safe and reliable designs, which culminate in excessive weight and manufacturing cost of the component. The S-N curves serve only as a baseline, with institutional knowledge taking the place of hard physics in designing against fatigue failures. Selected knockdown factors are based on past and related experiences. Also, different organizations have different experiences and therefore use different knockdown factors. This becomes problematic when a new design lies outside of the experience base. Increasing the knockdown factors and overdesign has to be weighed against the risk of failure in the field, none of which can be quantified.
Over the past 12 years, VEXTEC has developed a probabilistic computation tool called Virtual Life Management (VLM), which provides the algorithms that link the microstructural material properties and non-continuum mechanics. The VLM software platform can be used to predict the stress and strain versus fatigue life test results of simple test specimens, as well as components with complex geometry and loading. VLM can be used directly in the safe life analysis method without the need for large safety factors. The figure below compares the VLM-predicted fatigue lives with laboratory test data.
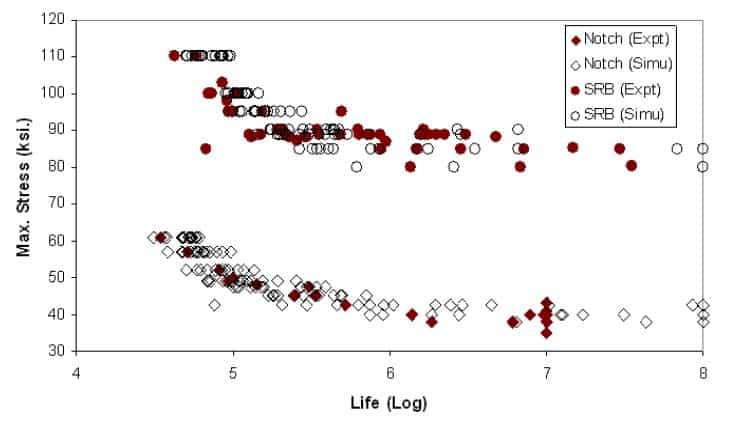
VLM prediction of smooth and notched titanium fatigue specimen with laboratory test data.
The exact same material model is used for both the smooth specimen and the notched specimen. Notice the good correlation between the predicted and actual data points. The model captures the notch similitude. This is significant because the notched specimen can be described by the notched specimen’s finite element model and the material’s mechanical properties that are determined by testing the smooth specimen. The additional tests to determine the notched S-N curve for each geometry can now be eliminated. The scatter in the fatigue lifetime is also predicted. The method has been applied directly to finite element models of complex components to predict the mean and scatter in fatigue life of the final component design. This can be a huge savings in money and time compared to the manufacture and testing of actual components.
In the next blog, we will explore the damage tolerance design methodology, and how VEXTEC’s Virtual Life Management (VLM) technology can be used to reduce the magnitude of the assumptions made and improve the accuracy and robustness of the DTA fatigue durability prediction.
References
Nishijima, S., Masuda, C., Abe, Komatsu, A., Ishii, A., Matsuyama, T., Sumiyoshi, T., Tanaka, Y., and Otsubo, S., “Statistical Fatigue Properties of Heat Treated JIS Steels S45C, SCM3, SNCM8, SK5, and SUS403 for Machine Use”, Trans. Natnl. Res. Inst. Met., vol. 19, no. 6, pp. 43-59, 1987.


Leave A Comment